Interface & features
Get familiar with the Store Directory screen layout and the main features before diving into the detailed guides.
This page introduces the overall layout of Store Directory and its main feature groups, so you know where everything lives before working through the detailed guides.
Overall layout
After signing in, the screen is split in two:
┌───────────────┬───────────────────────────────────────────────┐
│               │                                               │
│   NAVIGATION  │                                               │
│   BAR         │              CONTENT AREA                     │
│   (Sidebar)   │      (map list / data /                       │
│               │       map editor...)                          │
│               │                                               │
│   [Account]   │                                               │
└───────────────┴───────────────────────────────────────────────┘
Left navigation bar (Sidebar)
This is how you move between the main areas of the application. Two entries have submenus — click to expand them:
| Entry | What it does |
|---|---|
| Maps | All of your maps (the default page after signing in) |
| Analytics → System overview | Storage, users, maps and interactions across the whole account |
| Analytics → Reports | Customer behaviour on your published maps |
| Activity log | What members of the account have done — see Activity log |
| Data management → Datasets | The source data tables of your stores |
| Data management → Domain management | Shared value lists used by data fields — see Domain management |
Can't see all of these?
Reports and Activity log only appear when your account's service plan includes them. If they are missing from the navigation bar, contact your administrator to check your current plan.
At the bottom of the sidebar is the account area: the name and email of the signed-in user, a light / dark theme toggle, and the Switch account button (see Signing in & accounts).
Tip
You can collapse / expand the sidebar for more room. When you enter the map editor it collapses automatically so the map gets more space.
The main areas of the application
1. Map list
The first page you see after signing in. Each map is a card with a preview image, its name and when it was last edited; a filter lets you show only published or unpublished maps. From here you can create, open, rename and delete maps.
See also: Create a new map.
2. Datasets
Found under Data management. This is where source data lives: upload store data, view and edit the column structure, rename, delete. Data here can be placed onto any map.
See also: the Data section.
3. Analytics
Two reports, meaningful once a map has been published and customers have viewed it:
- System overview — how much of the account is in use: storage, number of users, number of maps, interactions over time.
- Reports — what customers do on your map: which stores they view, where they tap for directions, what they search for without a match, and which areas deserve a new store.
See also: the Analytics section.
4. The map editor
This is the most important workspace — where you build your store-locator page. The layout:
┌─────────────────────────────────────────────────────────────┐
│  TOOLBAR (map name · Save · Publish · basemap picker...)     │
├───────────────┬─────────────────────────────────────────────┤
│  LEGEND /     │                                             │
│  STORE LIST   │            INTERACTIVE MAP                  │
│               │           (shows your store data)           │
│  (left        │                            [Basemap ▾]      │
│   sidebar)    │                            [+ / − zoom]     │
├───────────────┴─────────────────────────────────────────────┤
│  DATA TABLE (open/close — view the data as a table)          │
└─────────────────────────────────────────────────────────────┘- Top toolbar: map name (click to edit), Save, Publish / Share, the basemap picker and other tools.
- Interactive map: the main area showing your data; zoom, pan, click a store to see its details.
- Left sidebar: switch between the Legend (layer list), the Store list and Directions.
- Data table below: view every record as a table.
Components of the map screen
Toolbar

The toolbar has two areas:
- Left — the back button to the map list, and the map name (click the name to rename it).
- Right — Save, Share (only shown once the map is published) and Publish.
When you open a dataset's settings, the two buttons on the right change to Cancel and Save settings.
The basemap picker sits on the map itself
The basemap button is not on the toolbar but directly on the map area, next to the zoom controls.
Legend
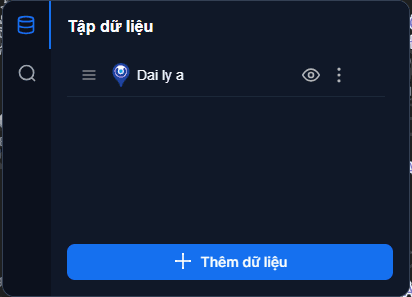
The legend lists the data layers added to the map along with their symbols, so viewers understand which group each icon on the map represents.
Every layer has a three-dot menu offering: Settings · Rename · View table · Opening hours · Bulk image upload · Delete layer. Point layers also get Conditional style — change the icon based on the value of a field.
At the bottom of the legend is the Add data button, which brings another existing dataset onto the map.
See also: Legend.
Detail panel
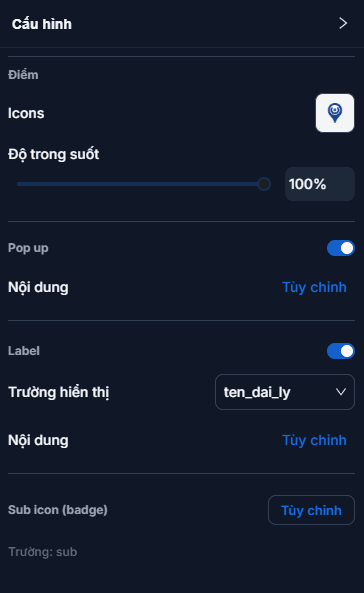
This is where you view and directly edit the information of the data shown on the map. It is hidden by default and appears when you select a layer in the legend or click a store on the map.
See also: Managing stores.
Data table
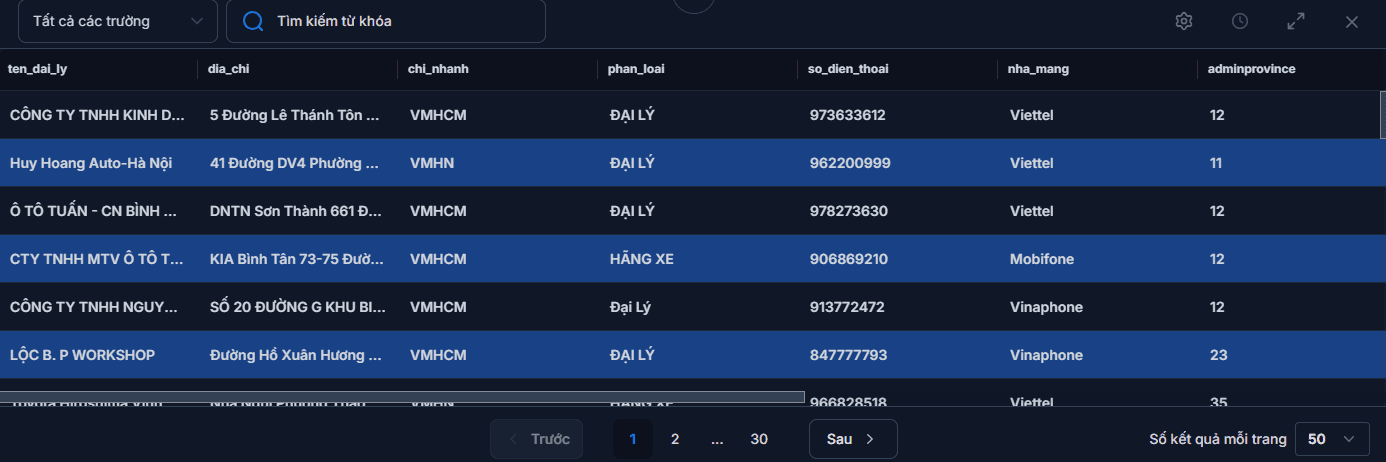
Shows all of a layer's data as a table, with search and download. Open it with the Data button on the floating toolbar at the top-centre of the map, or choose View table from a layer's three-dot menu in the legend.
See also: Data table.
The map
The main map area where you build your content:
- Click and hold to pan the map.
- Scroll to zoom in and out.
Map-building toolbar
A small bar floating at the top-centre of the map area (not on the toolbar) gathers the actions you use most while building a map:
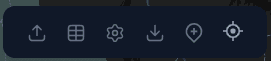
| Tool | What it does | See also |
|---|---|---|
| Upload | Push a data file up without leaving the map screen | Uploading files |
| Data | Open / close the layer's data table | Data table |
| Settings | Open the layer's display settings | Display customization |
| Export | Download the layer's data | Data table |
| Add point | Draw a new store directly on the map | Managing stores |
| Spatial query | Draw an area on the map to filter the stores inside it | — |
When a map has more than one layer, the three buttons Data · Settings · Export open a list so you can choose which layer to act on. With a single layer they run immediately.
Where do I add an existing dataset?
Not on this bar. The Add data button at the bottom of the legend is what brings an existing dataset onto the current map — see Managing data layers.
The main features at a glance
| Feature | What it does | See also |
|---|---|---|
| Basemap | Change the background layer (street, light, dark) | Basemap |
| Data layers | Put a dataset on the map, show/hide, reorder | Managing data layers |
| Legend | View & manage layers, symbols and colours | Legend |
| Display customization | Choose icons, colours, labels and popup content for your brand | Display customization |
| Managing stores | Add a new store point on the map, edit its details, move existing ones | Managing stores |
| Managing stores | Add, edit and delete stores | Managing stores |
| Images & opening hours | Attach photos and set opening hours per store | Images & opening hours |
| Search & directions | Find places and route to a store | Search & directions |
| Area filtering | Filter data by province/district | Area filtering |
| Data table | View & look up data as a table | Data table |
| Publish & share | Make the map public, get a link, embed it | Publishing & sharing |
| Analytics | Measure views, direction clicks and search demand | Getting started with analytics |
Basic map gestures
- Zoom in / out: the + / − buttons, the scroll wheel, or pinch (touch screens).
- Pan: drag the map.
- Rotate / tilt: hold the right mouse button (or Ctrl) and drag.
- See a store's details: click its point on the map.
- Undo: press Ctrl + Z (for example while drawing).
Worth remembering
Always Save, then Publish again
Click Save on the toolbar after each round of edits — unsaved changes can be lost when you leave the page.
Changes to data (stores, images, hours) are live once saved. Only changes to appearance (icons, colours, labels, popups, basemap, adding/removing layers) require a republish — see Publishing & sharing.
Next: Create a new map — build your first map page.