Legend
The legend helps viewers understand the symbols on your map.
The legend sits in the left sidebar of the map editor and lists every data layer on the map along with its symbol. It is both a key for viewers and your quick-action panel for each layer.
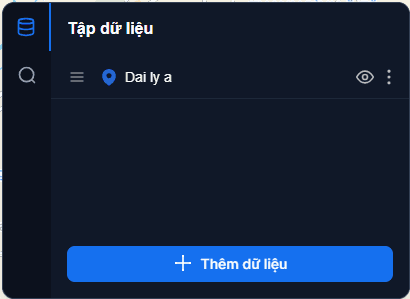
What the legend shows
Every data layer you add to the map automatically gets a row in the legend, containing:
- The symbol (icon and colour) currently used to draw that data on the map.
- The layer name.
- Quick action buttons: show/hide, and the three-dot menu.
That way viewers can glance at the legend and know which group each symbol on the map represents.
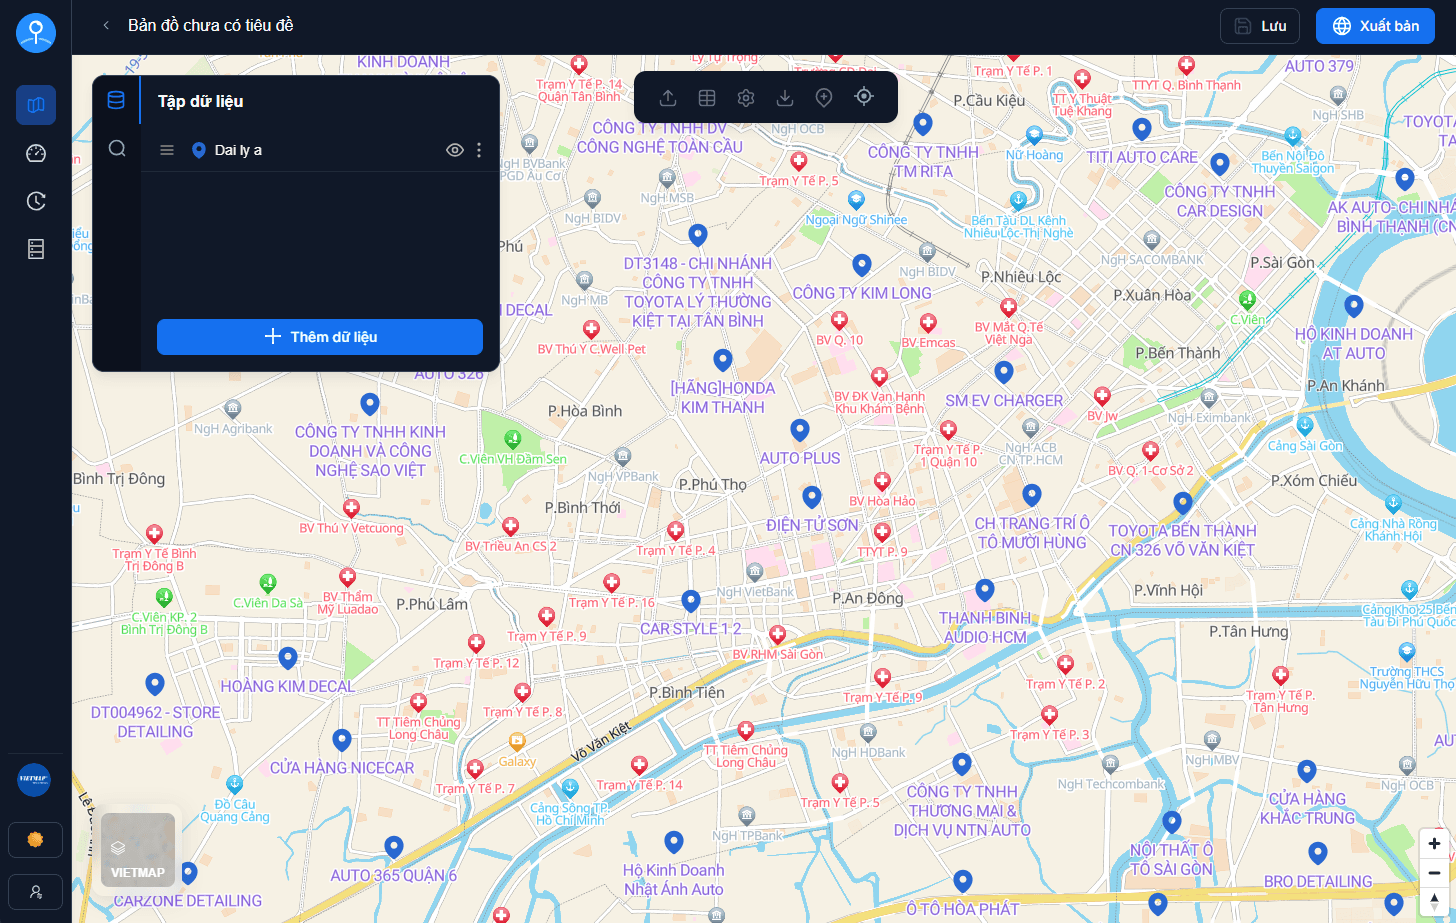
Changing the symbol shown in the legend
The symbol in the legend is simply the layer's style on the map. Click a layer in the legend and the styling panel opens on the right, where you change the icon and colours.
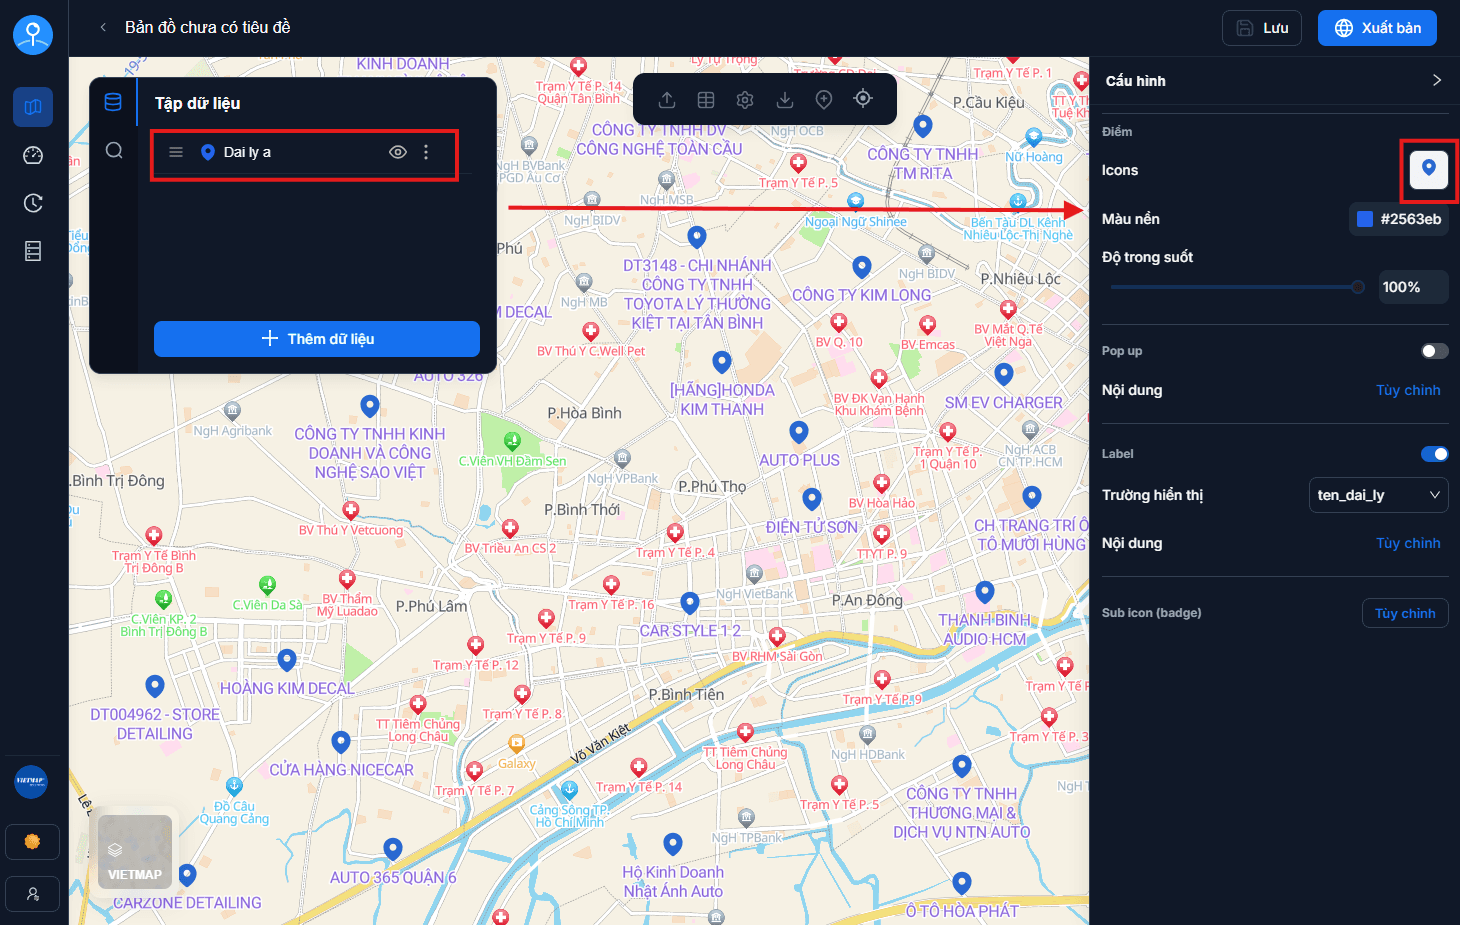
For details on choosing icons and colours, see Display customization.
Hiding / showing a layer
Click the eye icon next to a layer to hide or show it on the map.
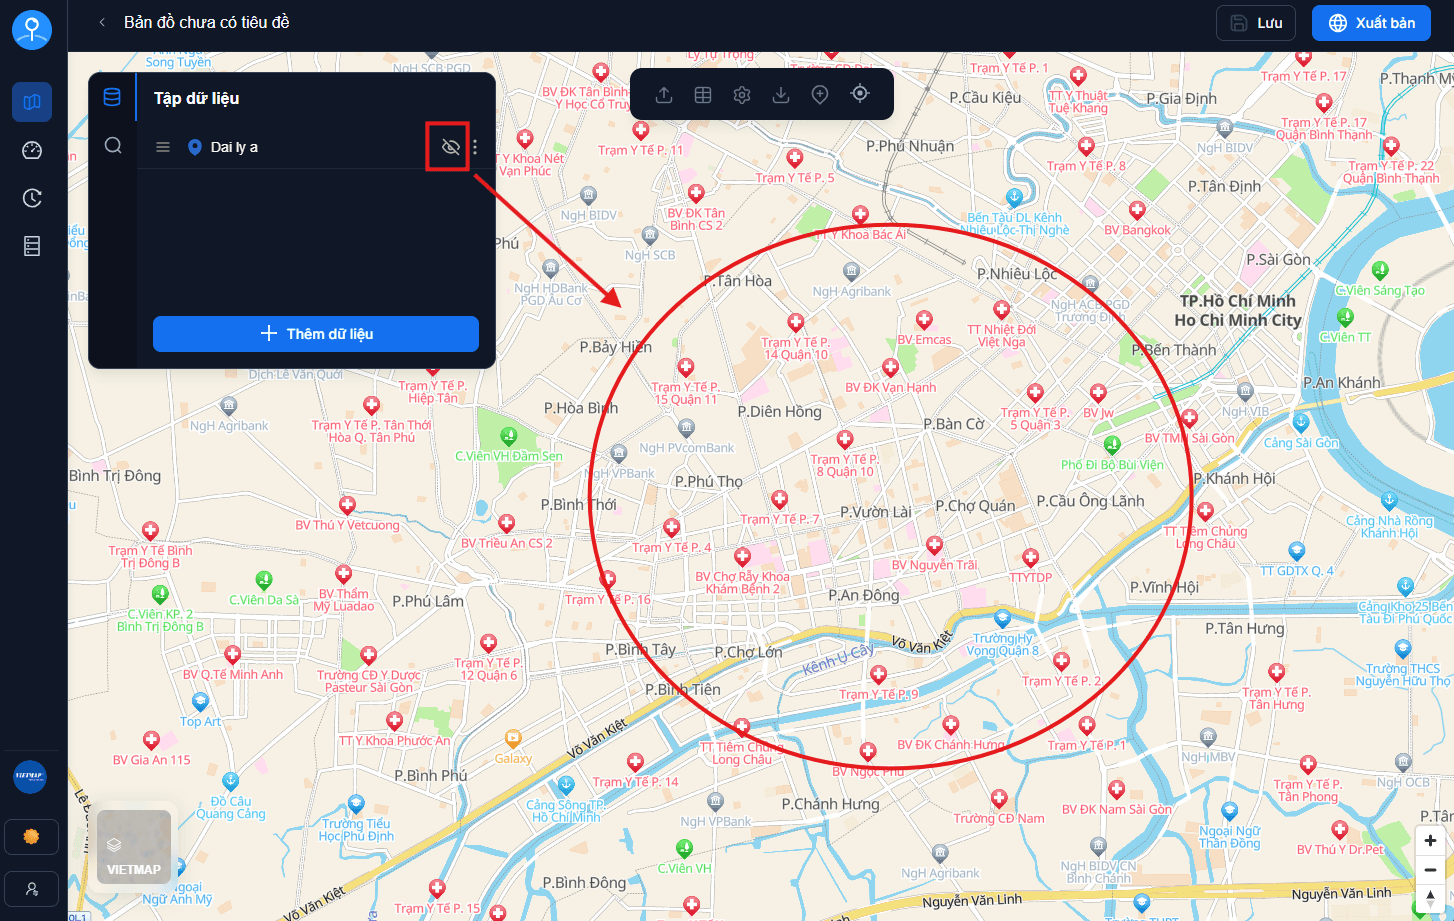
Hiding is not deleting
Hiding simply stops drawing the layer for now; the data is untouched. To remove a layer from the map entirely, see Managing data layers.
Other actions from the legend
The three-dot menu next to each layer offers:
| Action | What it does | See also |
|---|---|---|
| Settings | Open the layer's display customization | Display customization |
| Conditional style (point layers only) | Change the icon based on the value of a field | Display customization |
| Rename | Rename the layer as shown in the legend | — |
| View table | Open the layer's data table | Data table |
| Opening hours | Set open–close windows | Images & opening hours |
| Bulk image upload | Attach photos to many stores at once | Images & opening hours |
| Delete layer | Remove the layer from the current map | Managing data layers |
At the bottom of the legend is the Add data button — it brings another existing dataset onto the map.
Next: Managing data layers — add and remove layers from a map.