Getting started with analytics
How the Analytics area is organised, the dataset picker, comparison periods, and where the numbers come from.
Go to Analytics → Reports. This area is about what customers do on the maps you have published: which stores they view, where they tap for directions, what they search for without finding, and which areas are short of stores.
Read this page first, because the four conventions below apply to every report in the area.
Four report groups
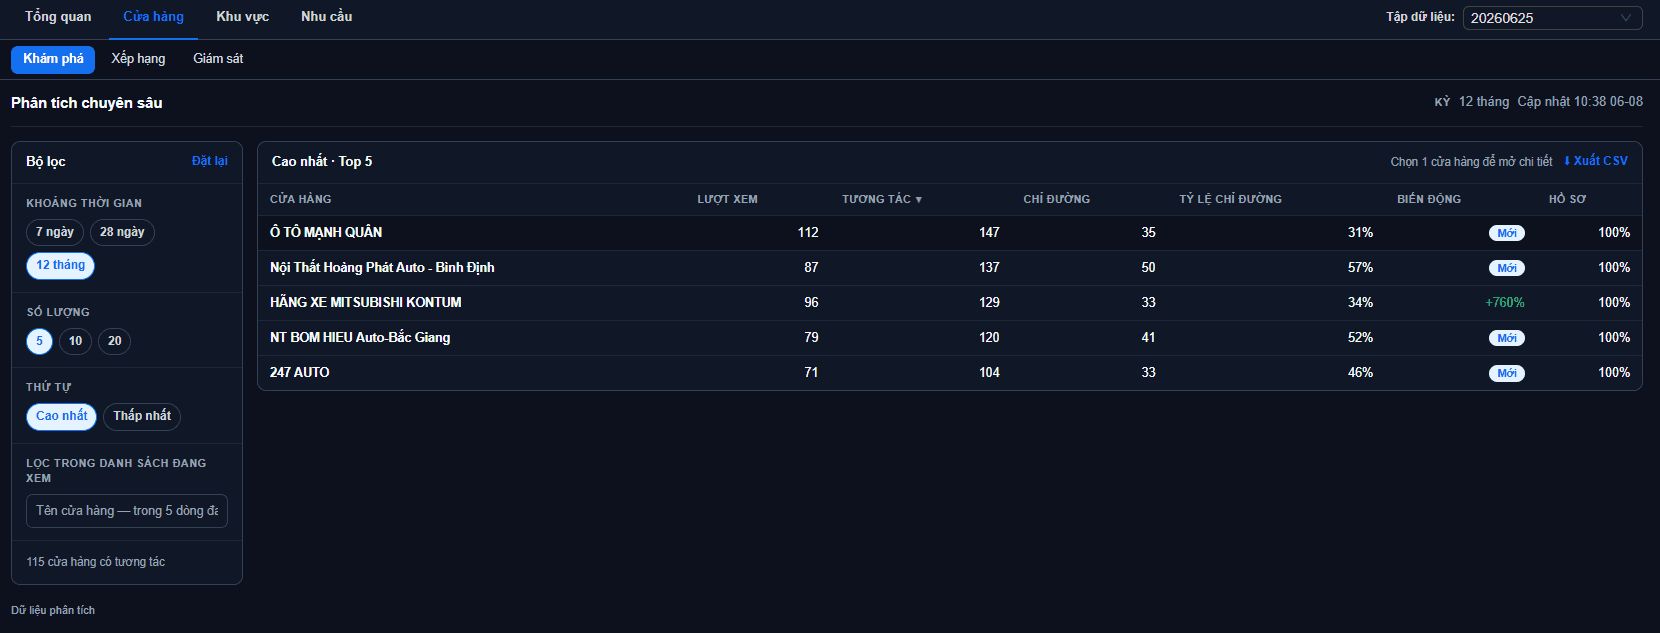
The navigation has two rows: the top row is the group, the bottom row the reports inside it.
| Group | Answers | Reports inside |
|---|---|---|
| Overview | How is my chain doing this period? | (stands alone, no sub-reports) |
| Stores | Which stores are doing well, which need rescuing? | Explore · Rankings · Monitoring |
| Areas | Which regions are getting attention? | Summary · Map |
| Demand | What are customers looking for that we don't have? | Search · Expansion |
The Overview group has no sub-tabs, so the second row is hidden while you are there.
The dataset picker
At the right of the top tab row sits the Dataset box. Every report in the Analytics area is calculated on the dataset selected here, so choosing once covers all tabs.
Only published datasets appear
This list only shows datasets belonging to published maps. A draft map has no viewers yet, so there is nothing to analyse. If the box says "No published dataset", publish a map first.
When you change dataset, any data-dependent filters (the selected area in Overview, or the province you had drilled into under Areas) reset to their defaults, so numbers from the previous dataset cannot bleed through.
Comparison periods
Each report has its own period picker at the right of its title bar. The whole system uses the same three periods:
| Period | This period is | The trend is drawn by | Compared against |
|---|---|---|---|
| This week | the last 7 days | day (7 points) | the 7 days immediately before |
| This month | the last 28 days | week (4 points) | the 28 days immediately before |
| This year | the last 12 months | month (12 points) | the 12 months immediately before |
Every "change", "previous period" and "rising / falling" figure compares against the immediately preceding period of the same length. Choosing This week compares 7 days with the 7 days before them, not against a calendar week.
Periods count back from today, not from the calendar
"This week" means the last 7 days counting back from today, not since Monday. Likewise "This month" is the last 28 days, not since the 1st. That keeps the two compared periods exactly the same length — but the numbers will differ from accounting reports based on calendar months.
The period follows you across tabs
Pick a period in one report and the others follow — no need to set it per tab, and figures on two tabs are always for the same period. The period resets to This week when you reload the page.
Every report uses these same three names; no tab calls them anything else.
Where the numbers come from
The system counts exactly two customer actions on a store:
| What is counted | Called |
|---|---|
| A customer opens a store's information | Store views |
| A customer taps the directions button for a store | Direction clicks |
Interactions = Views + Directions
The Interactions metric is the sum of exactly those two, with nothing else in it. So Interactions, Views and Directions are not independent — adding all three together double-counts.
Also:
- Searches and empty searches — counted from the search box on the public map, including searches that returned nothing.
- Profile completeness — computed from your own data: of the fields currently exposed to customers on published maps, what percentage has been filled in. See how it is calculated.
The figures include maps embedded on other websites, not just the public map page. Conversely, your own actions while building a map do not produce these numbers: opening the detail panel, editing information or dragging a store in the admin area are never counted.
If you use the API
If your own systems call the GISCloud API with an API key to fetch store data, each detail fetch also counts as a store view. That is deliberate: an application calling the API is another channel through which customers reach a store. If you run periodic sync jobs through the API, keep that in mind when reading the numbers.
Daily is as fine-grained as it gets
Interactions are stored by day, not by hour. That is why there is no peak-hour report, and why every period is cut on day boundaries.
Numbers update after about 15 minutes
Views and direction clicks are batched and written into the reports in waves, roughly 15 minutes apart. If you have just clicked a store and the report has not moved, that is normal — wait a moment and reload. Nothing is lost.
A new day starts at 07:00 Vietnam time
The system splits days by universal time (UTC), so in Vietnamese time a "day" runs from 07:00 today to 07:00 tomorrow.
That means interactions between midnight and 7am count towards the previous day. If you open a report early in the morning, "today" will look unusually small — nothing is lost, the new day simply has not started. After 7am it lines up again.
For daytime retail the skew is negligible, since almost nobody browses a store map before dawn.
A freshly published map has no numbers yet
A newly public map needs time to accumulate views. Empty or very sparse reports in the first few days are normal.
Opening a store's detail
In most reports, clicking a store name opens that store's detail page, keeping the period you were viewing. Click ← Back to return to the report you came from.
Read next
- Business overview — the four headline metrics, trend, movers and the to-do list.
- Store analysis — explore, rank, monitor and drill into individual stores.
- Area analysis — interactions by province/ward plus two visual maps.
- Demand analysis — what customers search for, and where to open next.
Where to start: open Business overview first — it is the report worth reading every week.