Store analysis
Three store-level reports — Explore, Rankings, Monitoring — plus the per-store detail page.
The Stores group gathers every store-level report. Three sub-tabs look at the same dataset for three different purposes:
- Explore — look things up, filter, export.
- Rankings — compare stores against each other by several criteria.
- Monitoring — spot the stores in trouble.
Explore
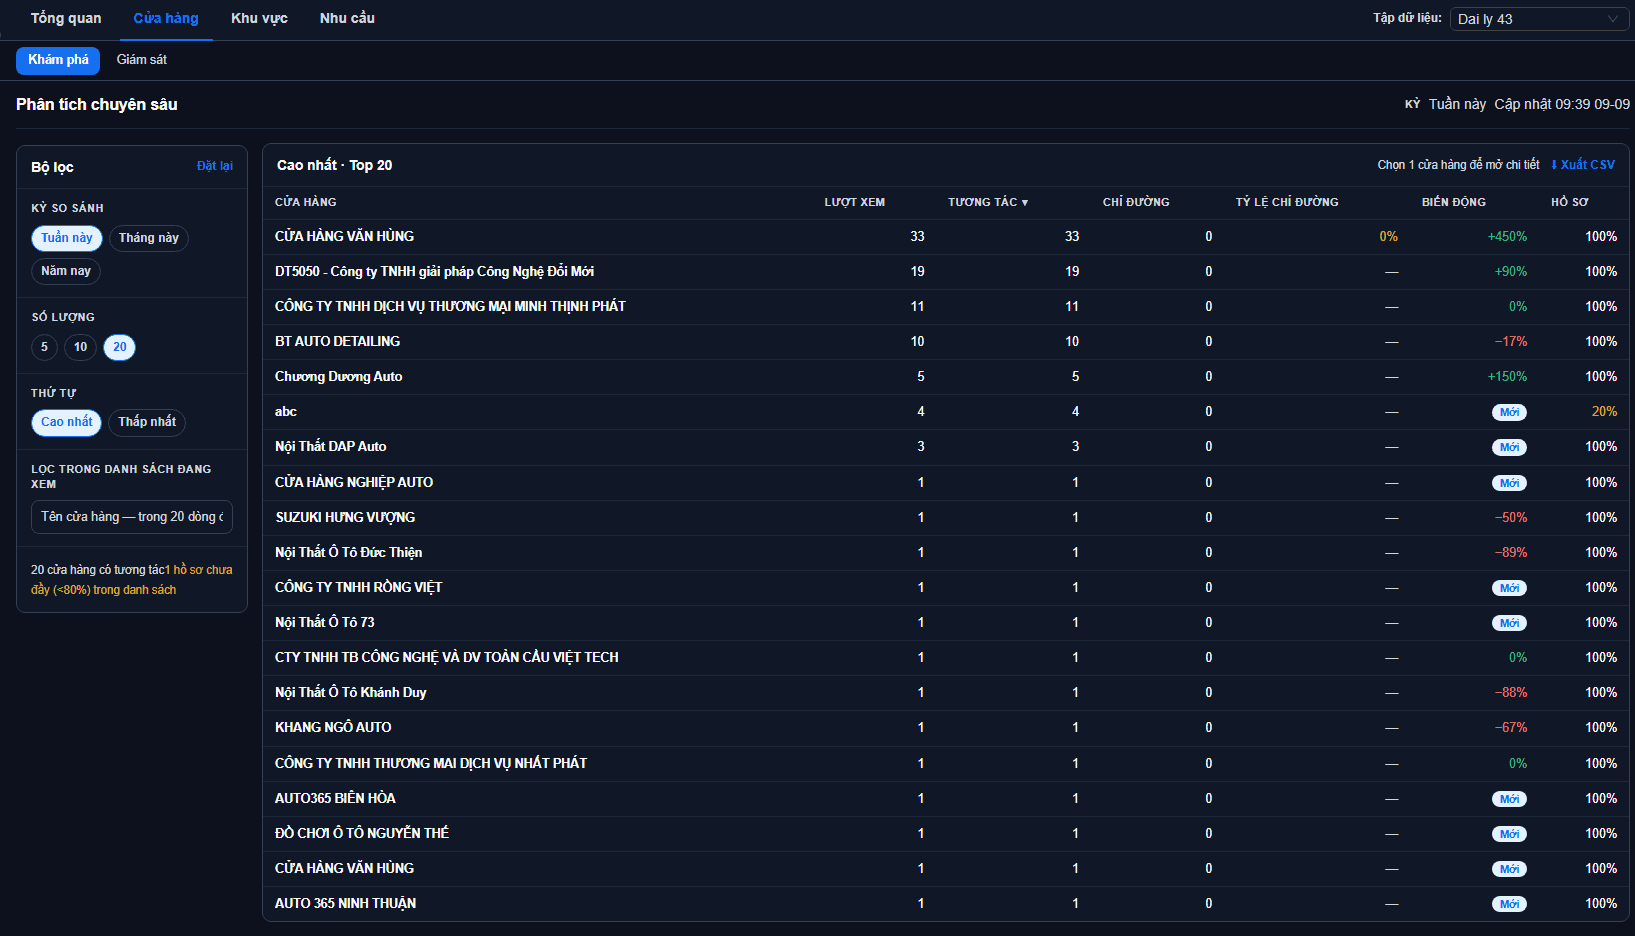
A store list table with filters in the left column.
Filters
| Filter | What it does |
|---|---|
| Period | This week / This month / This year |
| Count | Fetch 5, 10 or 20 stores |
| Order | Highest (best) or Lowest (worst) |
| Filter within the loaded list | Quick filter by name, among the rows currently shown |
This is a 'top' list, not the whole chain
The table only fetches as many stores as you set under Count, taken from the top or the bottom of the ranking. The filter box also searches only within the group on screen. Type the name of a store outside the top and the system tells you how many stores lie beyond the list, so you can raise Count or switch to Lowest.
The note under the filters gives the total number of stores with interactions in the period, and warns how many incomplete profiles are in the list you are viewing.
This table only contains stores that still have customers
Every table in the Stores group lists only stores with at least one interaction in the selected period. A store that dropped to zero never appears, even when you choose Lowest — which is why "N stores with interactions" is always smaller than your real store count.
Choosing Lowest therefore gives you the quietest stores that still have customers — exactly the group worth surveying, without mixing in the ones that have gone completely silent. Those are handled by the Needs attention block on the Overview tab.
The columns
| Column | Meaning |
|---|---|
| Views | How many times customers opened the store's information |
| Interactions | Total customer actions on the store |
| Directions | How many times customers tapped the directions button |
| Direction rate | Directions divided by views |
| Change | Interaction change against the previous period |
| Profile | Profile completeness — the percentage of customer-facing fields filled in |
Click the Views, Interactions or Directions header to change the ranking criterion.
'Direction rate' is not the share of customers who visited
It is the share of viewers who tapped the directions button on the map. The system does not know whether they actually turned up. Stores with fewer than 20 views show "—", because the sample is too small for the rate to mean anything.
The Change column shows "New" instead of a percentage when the store had no interactions last period.
A Profile value below 80% is flagged — the store is missing customer-facing information (address, phone, opening hours...). Fill it in via Managing stores.
Profile completeness is measured on customer-visible fields
The denominator is not every column in the dataset, but the fields you switched to Visible in the popup, store list or detail page of a published map. In other words: only what customers actually see is counted.
Three consequences worth knowing:
- A field you do not show is not counted — having it in the data but hidden neither raises nor lowers the percentage. Internal columns like management codes and private notes have no effect.
- Showing one more field drops the percentage immediately, even though you deleted nothing — the denominator just grew. That is a normal change, not lost data.
- A blank cell counts as unfilled. So does whitespace — typing a few spaces into a cell still counts as empty.
If a dataset is used by several published maps, the system merges the visible fields of all of them into the denominator.
Before publishing, this number is not comparable
When a dataset is not part of any published map, the system does not know which fields you intend to show, so it counts every column. The percentage is then usually much lower and cannot be compared with the figure after publishing. Read this metric after publishing and configuring your visible fields.
CSV export
The ⬇ Export CSV button at the right of the table downloads exactly the list on screen, with all columns. The filename records the period you were viewing, so exports never get mixed up.
Rankings
This tab compares stores by one criterion you choose, showing the Top 5 leaders and the Bottom 5 to watch side by side.
Six criteria: Interactions · Views · Directions · Direction rate · Profile completeness · Change.
Two criteria have their own eligibility rule, stated in the note under the table:
- Direction rate — only stores with 20 views or more.
- Change — new stores are skipped, having no previous-period baseline.
Rankings compare stores of a similar size
The table takes the group of stores leading on interactions and only then re-ranks them by your chosen criterion. That is deliberate: mixing in stores almost nobody visits would let a store falling from 3 views to 0 show −100% and take the top of the To watch column, pushing down a store that fell from 500 to 300 — while the latter is the one that matters.
So Change here answers "among the busy stores, who is slipping". To find "who fell hardest regardless of size", see Store movers and Needs attention on the Overview tab.
The table footer always states how many stores were ranked, how many were excluded and what the cap was — read that line to know your sample size.
When too few stores qualify to fill two columns, the system merges them into a single list.
Monitoring
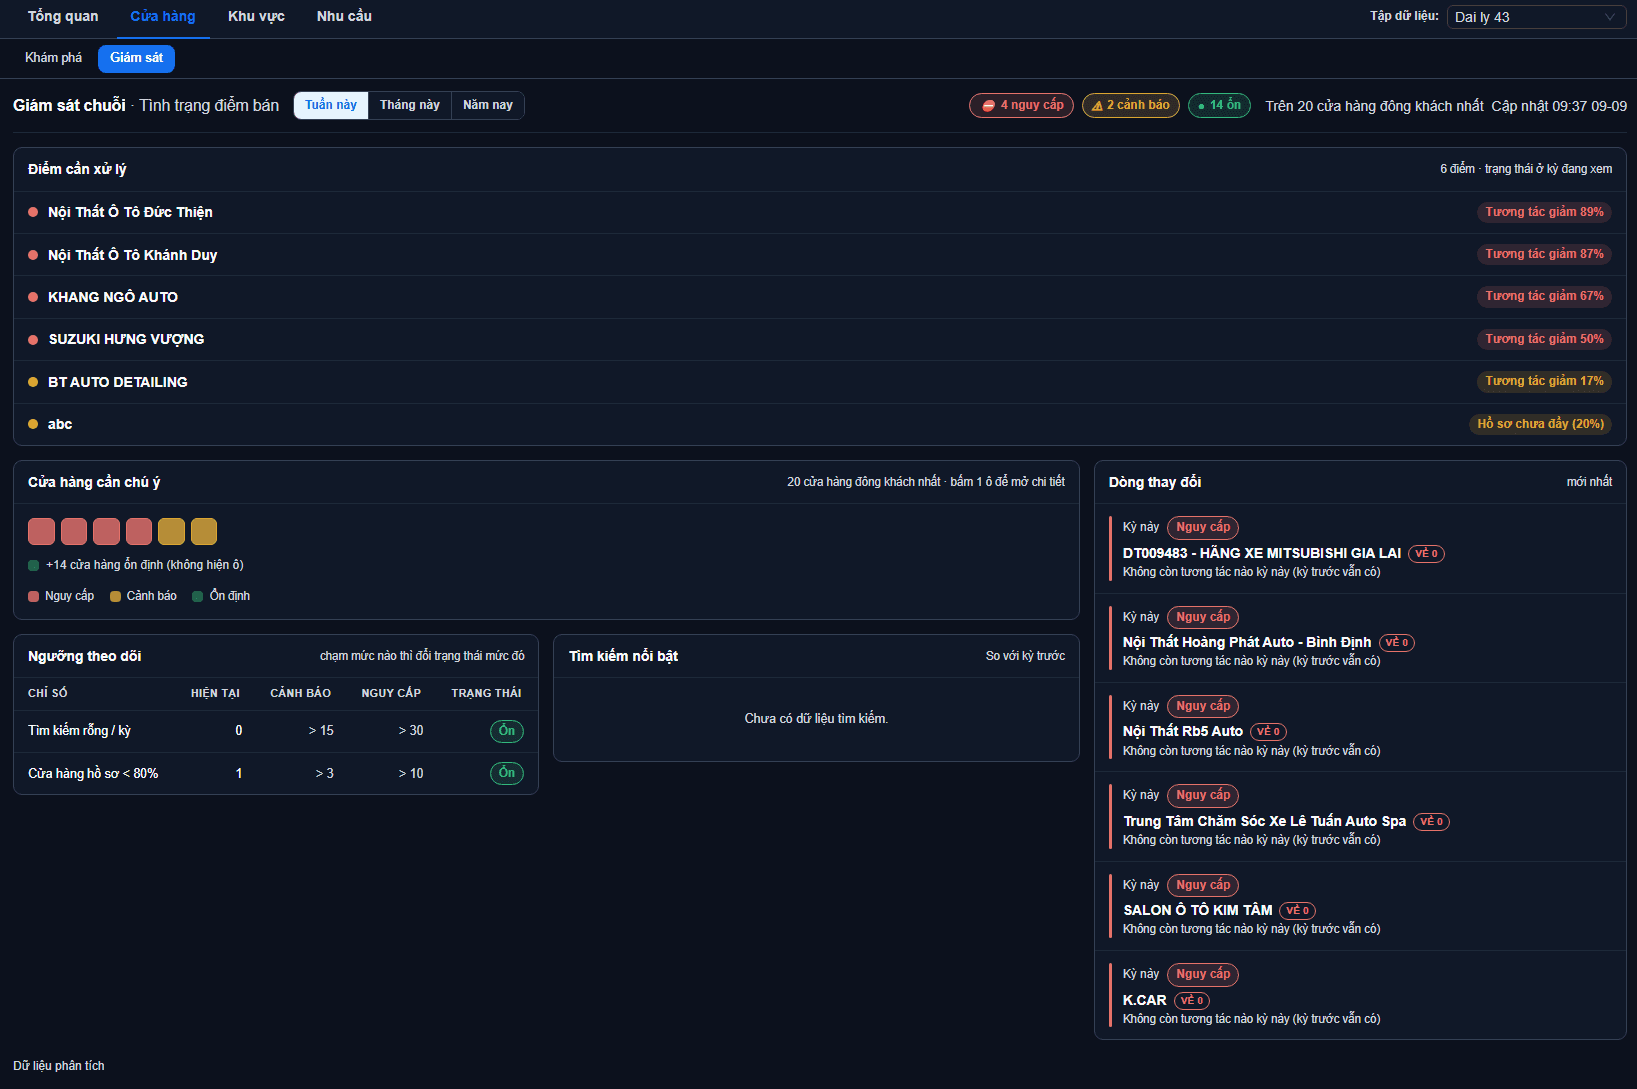
This tab answers exactly one question: among the stores that still have customers, which ones are losing steam?
It is not a full inventory of the chain. It is a duty screen — scan it each morning to catch stores sliding before they slide all the way. That is why it deliberately looks only at the stores with the most interactions in the period (up to 300), the group where a drop genuinely affects revenue.
Where do I find stores that lost all their customers?
A store at zero interactions in the period is not on this tab — it has no interactions left to compare. Those cases are covered by two other blocks, both of which run across the entire chain, with no 300 cap:
- Needs attention on the Overview tab — zero cases always sort to the top, tagged "dropped to zero".
- The change feed on this very Monitoring tab, in the right-hand column.
Put another way: the grid watches stores getting weaker, the other two watch stores that have already lost everyone. You need both.
Status summary
The top bar counts stores in three states, with a line stating how many stores are being counted. Two factors decide a store's state:
| State | When |
|---|---|
| Critical | Interactions down 20% or more against the previous period |
| Warning | Profile completeness below 80%, or interactions down 10% or more |
| OK | Neither of the above |
An incomplete profile counts as a warning too
A store growing nicely can still show Warning if its profile is under 80% filled. That is deliberate: missing information makes you harder to find, however good today's numbers look.
Stores to watch
A grid of tiles, each one a store with a problem. Hover a tile for its name, interactions, change and profile completeness; click to open the detail page.
Healthy stores get no tile
The grid only draws tiles for critical and warning stores. The count of healthy ones is summarised in a line below. In a chain of thousands, drawing every green tile would make it impossible to scan for the ones needing action.
The three figures are shares of the group, not of the chain
The small line beside them reads "Of the N busiest stores" — that is your sample size. In a 1,000-store chain, "258 OK" means 258 within the monitored group, not 258 out of 1,000.
The Stores with profile < 80% row in the thresholds table below counts within that same group. For a chain-wide figure, use the Profile column on the Explore tab.
Thresholds
Each row gives the current value, the warning level, the critical level and the state:
| Metric | Meaning | Default |
|---|---|---|
| Empty searches / period | Searches that returned nothing | Warning > 15 · Critical > 30 |
| Stores with profile < 80% | Stores still missing information | Warning > 3 · Critical > 10 |
> means the state changes when the value rises above that level, < when it falls below. A — means that level has not been configured.
Only metrics with a configured threshold are listed
A metric with no threshold set does not appear here — with nothing to compare against it would show "OK" forever, making you think it was being watched. As soon as an administrator sets a level for a metric, its row appears.
Thresholds live in the server configuration and cannot be edited from the interface. To change them, contact support.
The Empty searches and Total interactions rows cover the whole dataset; the Stores with profile < 80% row counts only within the 300 stores of the grid above.
Top keywords and the change feed
- Top keywords — up to 8 of the most searched terms, with their change against the previous period.
- Change feed — the stores slipping in this period; click one to open its detail. Each store appears once, with a severity label:
| Label | Meaning |
|---|---|
| Critical | Interactions down 50% or more |
| Warning | Down between 30% and 50% |
| Info | A mild drop, under 30% |
The block prioritises severe cases. Only when few stores have fallen hard does it list milder drops to fill the space — so a feed full of Critical and Warning labels signals a broad problem this period.
Monitoring always covers the whole account
Unlike the Overview tab, Monitoring has no area filter — it always watches the entire chain. This is a common reason the numbers on the two tabs do not match.
A store's detail page
From any report, click a store name to open its detail page. It keeps the period you were viewing and shows:
- Views, Directions, Interactions for the period.
- Change against the previous period — or the "New" label if there were no interactions before.
- Profile completeness, flagged below 80%.
- A trend chart of this period against the previous one.
A very new store has no trend to draw
The chart needs at least two time points with data. Without them the chart area stays empty — not a bug, just not enough history yet.
Click ← Back to return to the report you came from.
Next: Area analysis — view the chain by map and administrative boundary.